

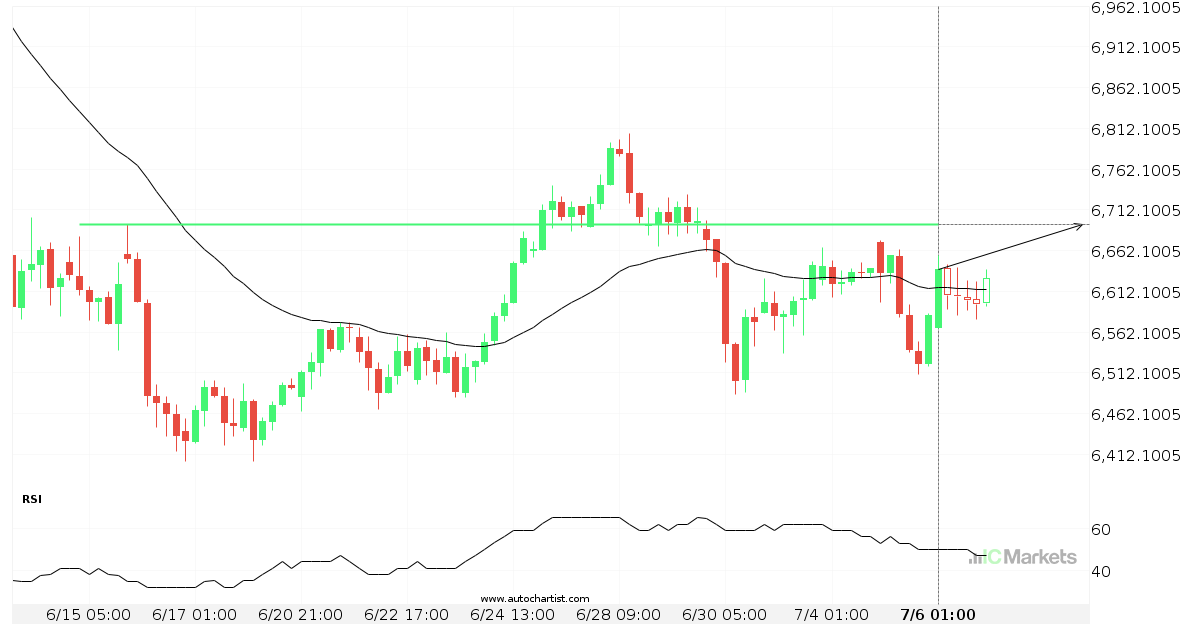
Australia 200 Index approaching important 6693.4902 price line
Australia 200 Index is approaching the resistance line of a Resistance. It has touched this line numerous times in the last 22 days. If it tests this line again, it could do so in the next 3 days.
Australia 200 Index approaching important 6693.4902 price line
Australia 200 Index is approaching the resistance line of a Resistance. It has touched this line numerous times in the last 22 days. If it tests this line again, it could do so in the next 3 days.
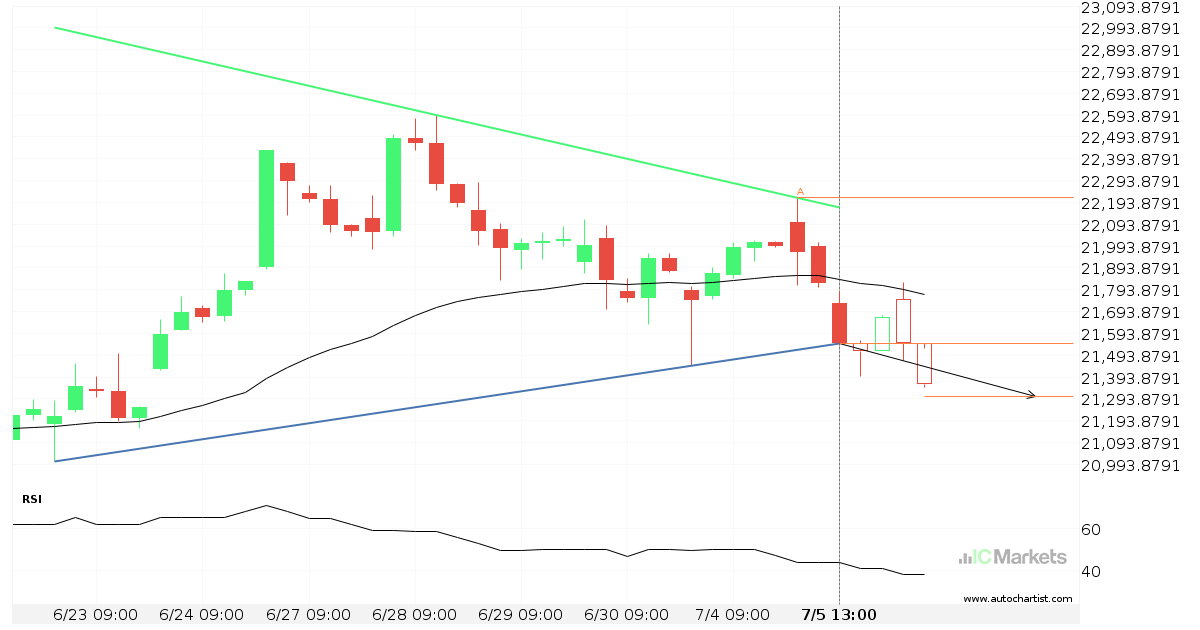
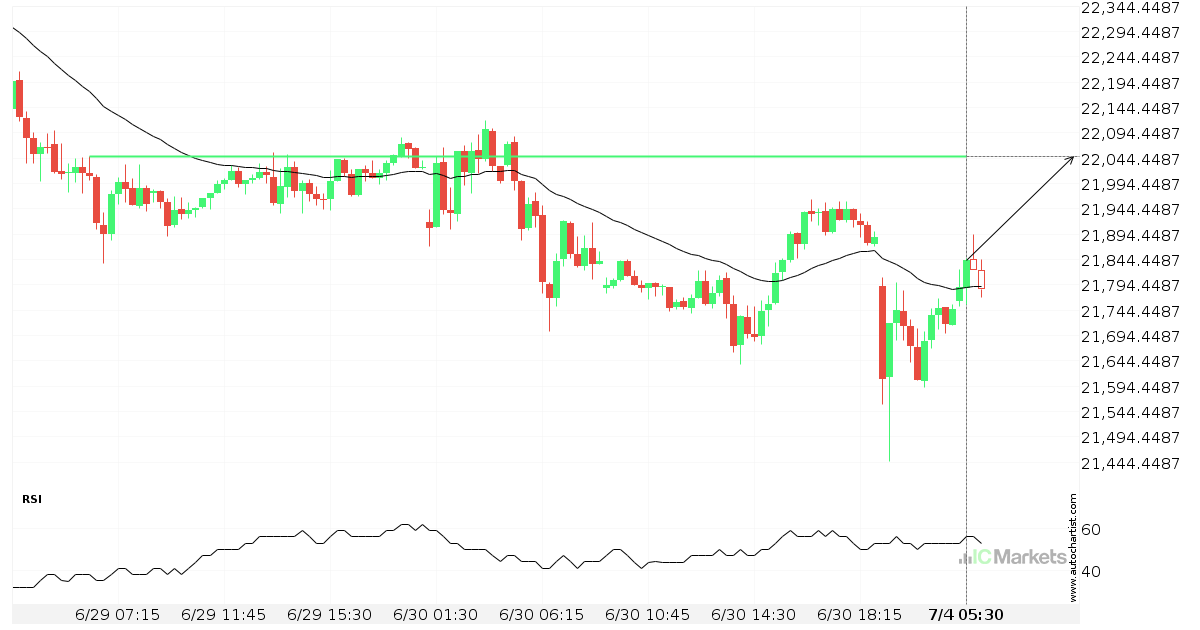
A possible start of a bearish trend on Hong Kong 50 Index
Hong Kong 50 Index has broken through a support line of a Triangle chart pattern. If this breakout holds true, we may see the price of Hong Kong 50 Index testing 21303.5569 within the next 2 days. But don’t be so quick to trade, it has tested this line in the past, so you should […]
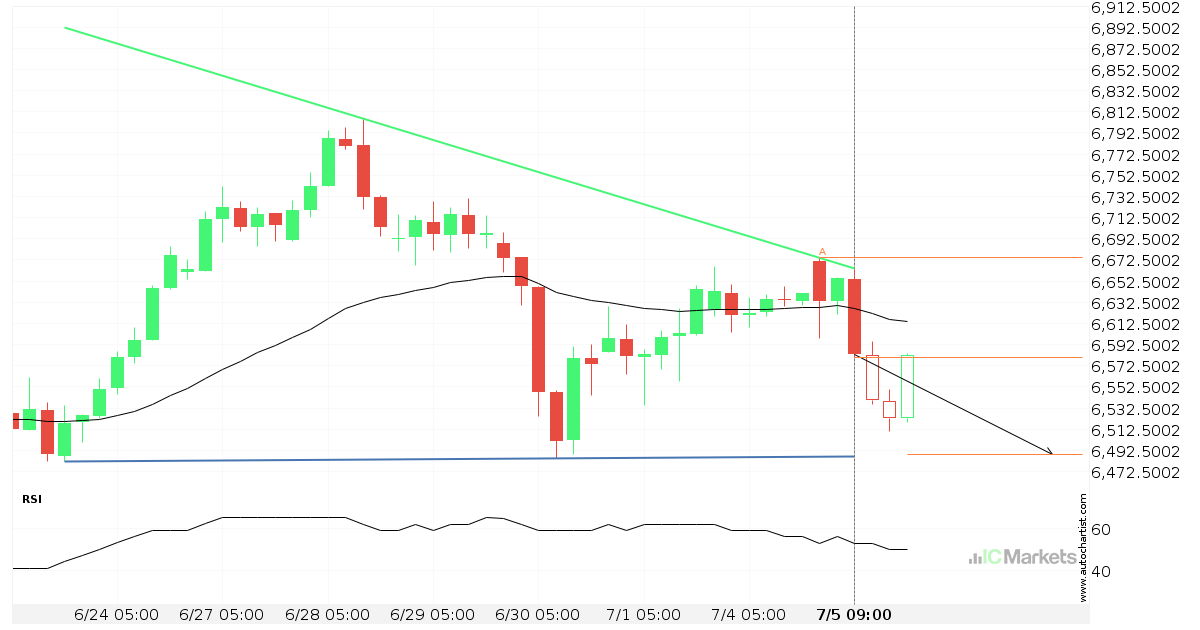
Australia 200 Index approaching support of a Descending Triangle
Australia 200 Index is approaching the support line of a Descending Triangle. It has touched this line numerous times in the last 12 days. If it tests this line again, it should do so in the next 2 days.

Australia 200 Index approaching support of a Descending Triangle
Australia 200 Index is approaching the support line of a Descending Triangle. It has touched this line numerous times in the last 12 days. If it tests this line again, it should do so in the next 2 days.
Hong Kong 50 Index – getting close to support of a Triangle
Hong Kong 50 Index is moving towards a support line. Because we have seen it retrace from this line before, we could see either a break through this line, or a rebound back to current levels. It has touched this line numerous times in the last 13 days and may test it again within the […]

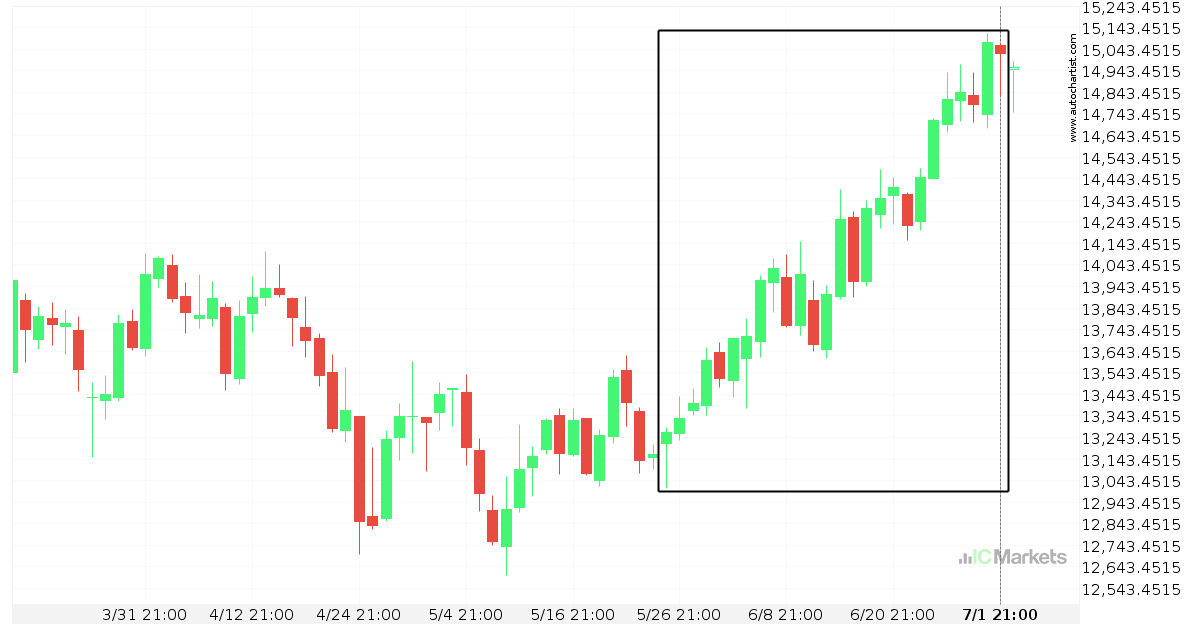
FTSE China A50 Index experienced an exceptionally large movement
For those of you that don’t believe in trends, this may be an opportunity to take advantage of an exceptional 13.23% move on FTSE China A50 Index. The movement has happened over the last 38 days. For those trend followers among you, you may think about riding this possible trend.
Hong Kong 50 Index – getting close to psychological price line
Hong Kong 50 Index is moving towards a resistance line. Because we have seen it retrace from this level in the past, we could see either a break through this line, or a rebound back to current levels. It has touched this line numerous times in the last 5 days and may test it again […]
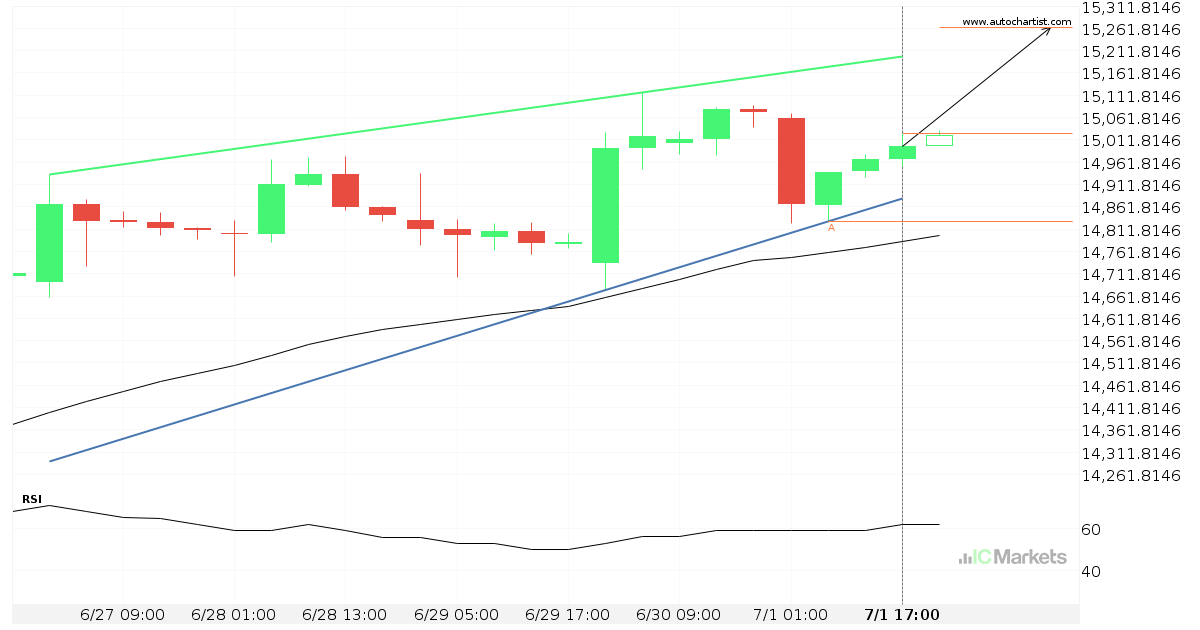
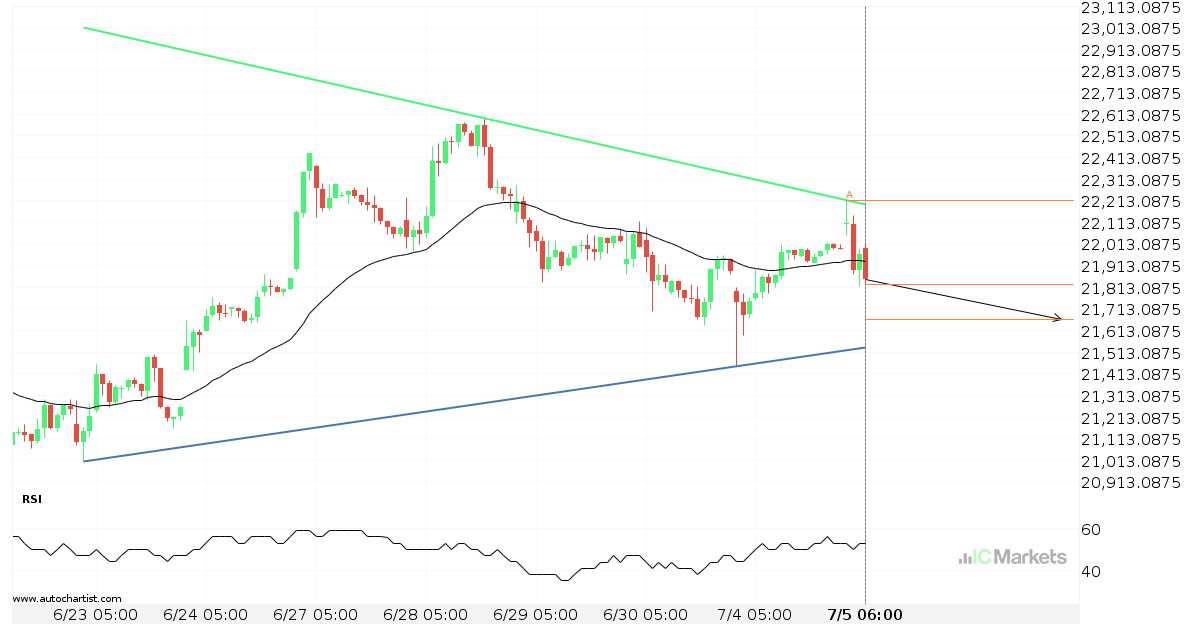
Should we expect a breakout or a rebound on FTSE China A50 Index?
The movement of FTSE China A50 Index towards the resistance line of a Rising Wedge is yet another test of the line it reached numerous times in the past. This line test could happen in the next 23 hours, but it is uncertain whether it will result in a breakout through this line, or simply […]